Spreadsheet Content Overview
A SpreadsheetML document is a package containing a number of different parts, mostly XML files.
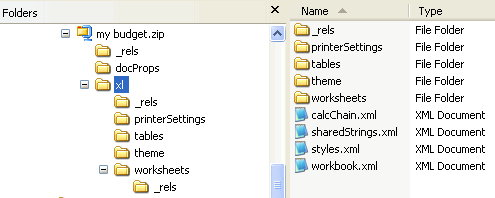
However, most of the actual content is found within one or more worksheet parts (one for each worksheet), and one sharedStrings part. For Microsoft Excel, the content is found within an xl folder, and the worksheets are within a worksheet sub-folder.
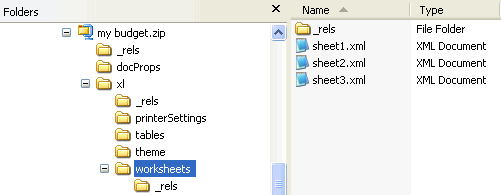
The workbook part contains no actual content but merely some properties of the spreadsheet, with references to the separate worksheet parts which contain the data.
A worksheet can be either a grid, a chart, or a dialog sheet.
The Grid
A grid of cells (or a "cell table") is the most common type or worksheet. Cells can contain text, booleans, numbers, dates, and formulas. It is important to understand from the outset that most text values are not stored within a worksheept part. In an effort to minimize duplication of values, a cell value that is a string is stored separately in the shareStrings part.(There is an exception to this generalization, however. A cell can be of type inlineStr, in which case the string is stored in the cell itself, within an is element.) All other cell values--booleans, numbers, dates, and formulas (as well as the values of formulas) are stored within the cell.
Some properties for the sheet are at the beginning of the root <worksheet> element. The number and sizes of the columns of the grid are defined within a <cols>. And then the core data of the worksheet follows within the <sheetData> element. The sheet data is divided into rows (<row>), and within each row are cells (<c>). Rows are numbered or indexed, beginning with 1, with the r attribute (e.g., row r="1"). Each cell in the row also has a reference attribute which combines the row number with the column to make the reference attribute (e.g., <c r="D3">). If a cell within a row has no content, then the cell is omitted from the row definition.
The make-up of a cell is important in understanding the overall architecture of the spreadsheet content. Each cell specifies its type with the t attribute. Possible values include:
- b for boolean
- d for date
- e for error
- inlineStr for an inline string (i.e., not stored in the shared strings part, but directly in the cell)
- n for number
- s for shared string (so stored in the shared strings part and not in the cell)
- str for a formula (a string representing the formula)
When a cell is a number, then the value is stored in the <v> element as a child of <c> (the cell element).
A date is the same, though the date is stored as a value in the ISO 8601 format. For inline strings, the value is within an <is> element. But of course the actual text is further nested within a t since the text can be formatted.
For a formula, the formula itself is stored within an f element as a child element of <c>. Following the formula is the actual calculated value within a <v> element.
When the data type of the cell is s for shared string, then the string is stored in the shared strings part. However, the cell still contains a value within a <v> element, and that value is the index (zero-based) of the stored string in the shared strings part. So, for example, in the example below, the actual string is the 9th occurrence of the <si> element within the shared strings part.
The shared string part may look like this:
Tables
Data on a worksheet can be organized into tables. Tables help provide structure and formatting to the data by having clearly labeled columns, rows, and data regions. Rows and columns can be added easily, and filter and sort abilities are automatically added with the drop down arrows.

The actual table data for the cells is usually stored in the worksheet part as any other data, but the definition of the table is stored in a separate table part which is referenced from the worksheet in which the table appears.
Within the rels part for the worksheet is the following:
The table part is shown below.
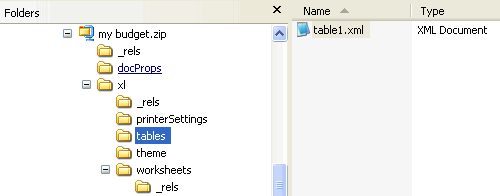
The content of the table part is below.
The ref attribute in red above defines the range of cells within the worksheet that comprise the table.
Pivot Tables
Pivot tables are used to aggregate data, and to summarize and display it in an understandable layout. For example, suppose I have a large spreasheet which captures the sales of four products in four cities. I may have a column for the product, date, quantity sold, city, and state. Each day has an entry for each product in each city, or 16 entries per day. So even with only 4 products in 4 cities, I could have 5840 rows of data for a year. What if wanted to determine what city had the most sales in the spring months? What product was improving? What city had the greatest sales of red widgets? Pivot tables help to summarize the data and quickly provide the answers to these questions.
Pivot tables have a row axis, a column axis, a values area, and a report filter area. Each table also has a field list from which users can select which fields to include in the pivot table. Below is a pivot table that summarizes the sales and revenue by product.

A pivot table is comprised of the following components.
- There is the underlying data that the pivot table summarizes. This data may be on the same worksheet as the pivot table, on a different worksheet, or it may be from an external source.
- A cache or copy of that data is created in a part called the pivotCacheRecords part; a cache is needed when, e.g., the external data source is unavailable.
- There is a pivotCacheDefinition part that defines each field in the pivot table and contains shared items, much like the sharedStrings part contains strings to remove redundancy in a worksheet.
- The pivotTable part defines the layout of the pivot table itself, specifying what fields are on the row axix, the column axix, the report filter, and the values area.
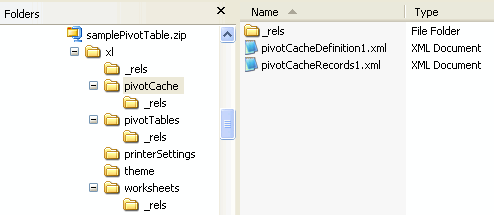
The workbook points to and owns the pivotCacheDefinition part. There is the reference in the workbook to the cache of data for the pivot table, following the references to the worksheets:
The rels part for the workbook contains that reference:
The pivotCacheDefinition part in turn points to the pivotCacheRecords part.
The pivotCacheDefinition part also references the source data in its <cacheSource> element:
The worksheet that contains the pivot table references the pivotTable part. (There may be more than one, since a worksheet can have more than one pivot table.) The rels part for the worksheet contains that reference:
The pivotTable part references the pivotCacheDefinitions part. The rels part for the pivotTable part contains that reference:
pivotCacheDefinition
Now let's look briefly at these parts and try to make sense out of them. Let's begin with the pivotCacheDefinition. As mentioned above, it specifies the location of the source data. It also defines each field (such as data type and formatting to be used) in the source data, including those not used in the pivot table. (What fields are actually used is specified in the pivot table part.) And it is used as a cache for shared strings, just as the SharedStrings part is used to store strings that appear in worksheets.
The definition of the six fields in our example worksheet is below.
The first field defined above is the product field. It consists of shared string values. If the field does not have shared string values (such as the second field defined above--the Quantity Sold field), then the values are stored directly in the pivotCacheRecords part.
pivotCacheRecords
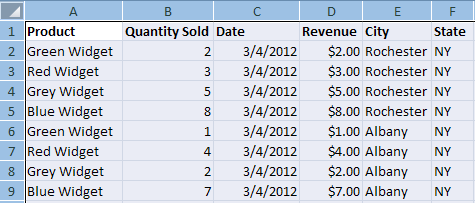
Let's look at the pivotCacheRecords part to see how the field definitions relate to the cached data. Below are the first two rows of data in the cache.This corresponds to the data from the worksheet shown below.

Note first that each record (<r>) of the cached data has the same number of values as are defined in the pivotCacheDefinition--in our case, six. Within each record are the following possible elements:
- <x> - indicating the index value referencing an item for the field as defined in the pivotCacheDefinition
- <s> - indicating a string value is being expressed inline in the record
- <n> - indicating a numeric value is being expressed inline in the record
Looking at the two sample records from the pivotCacheRecords above, we know from the pivotCacheDefinition that the six values are product, quantity, date, revenue, city, and state in that order. The Product field in the first record is <x v="0"/>, so the value (0) is an index into the items listed in the product field. The first one listed (index 0) is Green Widget. The second or quantity field value is <n v="2"/>, so the value (2) is a numeric value expressed inline. The third or date field value is <x v="0"/>, so the value (0) is an index into the items listed in the date field (2012-03-04T00:00:00 or 3/4). Etc.
pivotTable
Now let's look at the pivotTable part. The root element is the <pivotTableDefinition> element. There are several components within this. First, the location of the pivot table on the worksheet is specified. The location is straightforward. Note that both the first header and data columns are specified.
The order of items for fields and other field information for each field is then specified by <pivotField> elements within a <pivotFields>.
From the pivotCacheDefinition we know that the first <pivotField> above is the product. It has 5 items listed. The first one is <item sd="0" x="3"/>. The sd attribute indicates whether the item is hidden. A value of 0 means the item is not hidden. The x attribute is the index for the items in the <cacheField> for the product in the pivotCacheDefinition. The <cacheField> is shown below. Note that the value of the item at index 3 is Blue Widget, so Blue Widget should appear first in the pivot table if and where the product field is shown.
The second item has an index of 0, or "Green Widget", the third is 2 or "Grey Widget," and the fourth is 1 or "Red Widget." Note that <item t="default"/> indicates a subtotal or total.
Following the <pivotFields> collection is the <rowFields> collection. This collection specifies what fields are actually in the pivot table on the row axis, and in what order. In our example, when we fully expand the first row, we see that a row consists of first a product, then a city, followed by a state, and then a date. These are the row fields.
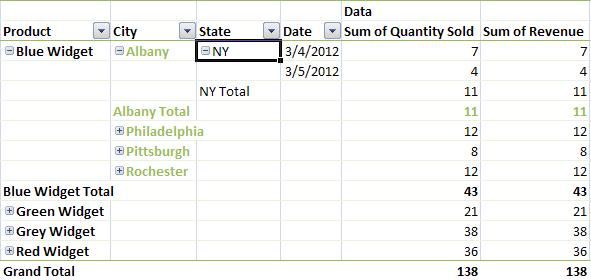
Following the index order in the <pivotFields> collection, this is 0, 4, 5, 2. The corresponding <rowFields> looks like this.
After the <rowFields> collection is the <rowItems> collection. This is a collection of all the values in the row axis. There is an <i> element for each row in the pivot table. And for each <i> there are as many <x> elements as there are item values in the row. The v attribute is a zero-based index referencing a <pivotField> item value. If there is no v then the value is assumed to be 0. The value of grand for t indicates a grand total as the last row item value.
The <colFields> collection follows, indicating which fields are on the column axis of the pivot table. Here again <x> is an index into the <pivotField> collection.
The <colItems> collection follows, listing all of the values on the column axis.
There may also be a <pageFields> collection which describes which fields are found in the report filter area.
Finally, there is a <dataFields> collection, which describes what fields are found in the values area of the pivot table. In our example, there are two fields in the values area -- sum of quantity sold and sum of revenue. Below is the collection. The fld attribute is the index of the field being summarized.
